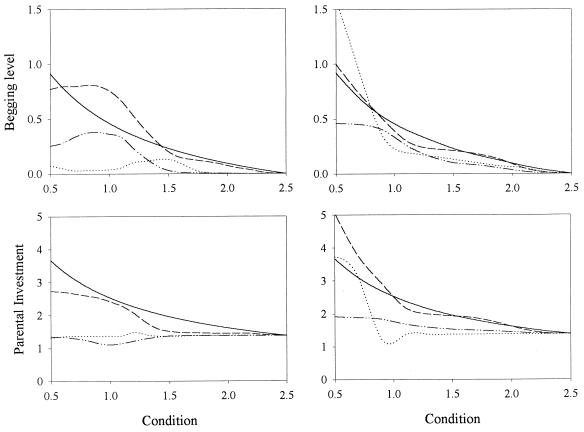
Figure 1.
Two-round contest. Mean begging level (Upper) and parental investment (Lower) plotted as a function of chick’s condition when population size was N = 100 (Left–shows average over five runs) and N = 1,000 (Right–single run). The solid line represents the initial condition and the others values after 1,000, 5,000 (dashed lines) and 10,000 (dotted lines) generations. Young condition c was selected from a rectangular distribution (0.5–2.5) (2). Young and parental inclusive fitness (2) were calculated according to Fch = (1 − e−c⋅y) − V⋅x − r⋅γ⋅y and Fp = (1 − e−c⋅y) − V⋅x − γ⋅y, respectively (V = 0.1, γ = 0.08, r = 0.5). The contest started at the signaling equilibrium. Signaling strategies were coded as interpolation tables which could mutate with probability 0.05. An offspring strategy coded for the begging intensities x(ci) associated with evenly distributed conditions ci (i = 0, … nc; c0 = 0.5, cnc = 2.5; nc = 20 for N = 100 and nc = 10 for N = 1,000), and a parental strategy coded for the parental investment levels y(xi) associated with evenly distributed begging intensities xi (i = 0, … nx; x0 = 0.0, xnx = 2.5; nx = 50 for N = 100 and nx = 25 for N = 1,000). The begging strategy for a chick with condition c and the parental response to a begging intensity x were determined from the x(ci) and y(xi), respectively, by polynomial interpolation (third order). In case of mutation, a “bump” was added to the table by randomly choosing an integer J (uniform distribution between 0 and nc or nx) and a real z (standard normal distribution) and adding to every entry i in the table the amount 0.2⋅(0.05 + w)⋅z⋅exp[−(8⋅(i − J)/nw)2] where w = x(cJ) and nw = nc for the offspring strategy and w = y(xJ) and nw = nx for the parental strategy. To avoid ending with oscillating strategies, the interpolation tables were smoothed to ensure that they had at most one maximum and one minimum (the highest and lowest values in the table were looked for, and terms were ordered in the three sections: from first term to first extremum, between the two extrema, and between second extremum and end of table).

