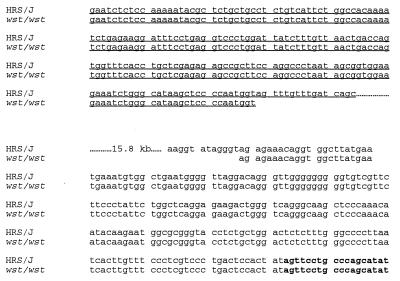
Figure 3.
Sequence analysis across the deletion breakpoint region in wasted and wild-type (HRS/J) mice. Underlined sequence represents the gag gene of the IAP element and nonunderlined sequence is intron 1 of Eef1a2. Sequence in bold is exon II of Eef1a2. Dotted lines indicate the 15.8 kb deleted in wst/wst mice.

