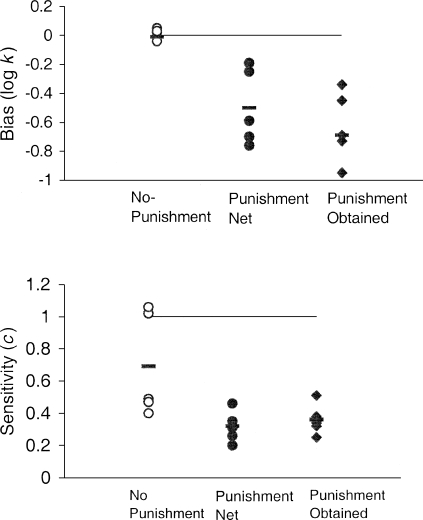
Fig 3.
Values for bias (log k; top panel) and sensitivity to reinforcement (c; bottom panel) parameters for the no-punishment (open circles), punishment-net (closed circles), and punishment-obtained analyses (closed diamonds). In the top panel, the horizontal line represents the bias value under perfect matching (log k = 0); in the bottom panel, the horizontal line represents the sensitivity value under perfect matching (c = 1). Dashes represent means.

