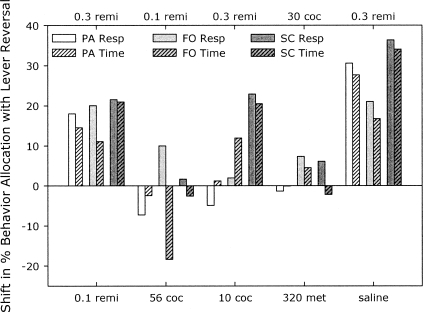
Fig 9.
Shift in percentage of responses or time allocated, independent of schedule pairing, to one drug when levers were reversed. Downward deflected bars indicate a shift toward the drug alternative on the lower horizontal axis, and upward deflections indicate a shift toward the alternative on the upper horizontal axis. Solid bars represent response allocations and hatched bars represent time-allocation data. Data are averaged from stable conditions for all RI schedule combinations. All doses are µg/kg/inj. Note: remi = remifentanil; coc = cocaine; met = methohexital.

