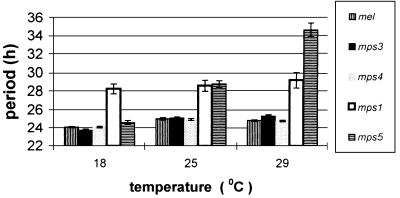
Figure 3.
Pooled mean (±SEM) free running locomotor activity periods for the different transformants at 18, 25, and 29°C. Data for the individual lines are in Table 1. mps5 gives a dramatic increase in period at higher temperatures. mps2 results are not shown as most transformants were arrhythmic, and those that were rhythmic showed a wide range of periodicities (see Table 1).

