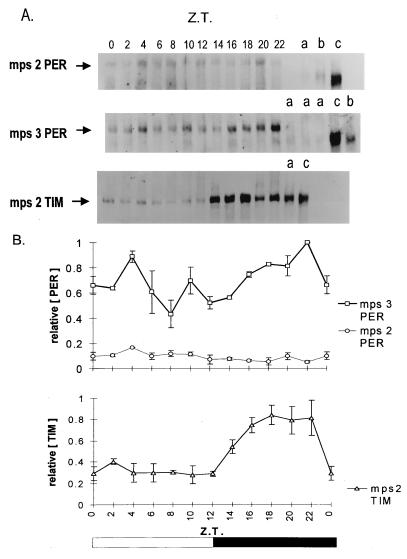
Figure 4.
(A) Western blots of mps2 and mps3 transformant heads collected at different Zeitgeber times (ZT 0, lights on; ZT 12, lights off) in LD 12:12 at 25°C. Lanes on the right show per01 (a), tim0 (b), and per+ Canton-S (c) controls at ZT 0, except for the TIM blot where the controls were taken at ZT 18. From top to bottom are shown: mps2 blotted with anti-PER; mps3 blotted with anti-PER; mps2 blotted with anti-TIM. The predicted primary Mr of the mps2–5PER product is 136,000, heavier than either D. melanogaster (128,000) or D. pseudoobscura (132,000) proteins. However, D. melanogaster PER runs at about 180,000 (32), and the chimeric MPS proteins run a little higher. (B) Densitometry analysis for three separate anti-PER and anti-TIM blots. The highest intensity PER or TIM band within each blot was given a value of unity. Means ± SEM are shown. Control experiments in which serial amounts of total protein were loaded for mps3PER, wild-type PER, and mps2PER at ZT 0, followed by Western blotting with anti-PER, revealed an approximate 5- to 7-fold reduction in mps2PER intensity for the same amount of protein (data not shown). No characteristic wild-type PER cycling (32) was ever observed in mps2 blots, although all three blots showed the highest protein levels at ZT 4. Western blotting was performed as in ref. 32 with minor modifications. Rabbit anti-PER antibody (gift of J. Hall and R. Stanewsky) was used at a concentration of 1:10,000, and rat anti-TIM antibody (gift of M. Myers) was used at 1:1,000. On each Western blot, equal amounts of proteins were used for each time point and for controls, but the amounts loaded varied between 50 and 200 μg, depending on the genotype.

