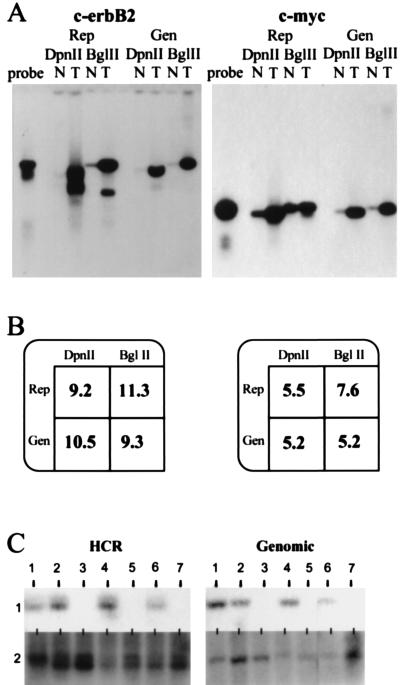
Figure 2.
Analysis of copy number using representations (Rep) and genomic DNA (Gen) for c-erbB2 and c-myc. (A) Southern blot comparing tumor cell lines (T) to normal (N) cell lines. DpnII was used to prepare HCRs (DpnII), and BglII was used to prepare LCRs (BglII). As a reference, free probe also was run alongside the samples (probe). The hybridization probes were derived from small BglII fragments isolated from P1 clones specific for each locus respectively. (B) Quantitation of the Southern blot. Rep, representation; Gen, genomic DNA; DpnII, either DpnII HCR or DpnII digest of genomic DNA; BglII, either BglII HCR or BglII digest of genomic DNA. Blots in A were stripped and reprobed with a single copy probe to analyze loading differences (data not shown). Phosphorimage analysis of this probe was used to normalize the amplification differences. After this analysis, the resulting intensity of tumor was divided by the intensity of normal to give the fold amplification displayed. (C) Deletion mapping using HCRs and the deletion mapping of seven tumor cell lines comparing blots of HCRs (HCR) with blots of the corresponding genomic DNA (Genomic), each designated 1–7. The probe used for hybridization is from the human genomic region 20p11 (HCR). The Genomic panel shows the same DNAs blotted with an unrelated probe.

