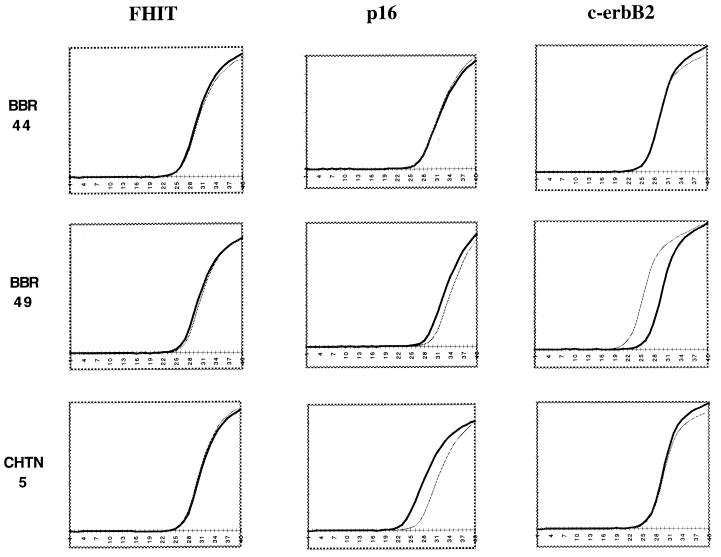
Figure 4.
Quanitative PCR analysis of HCRs. Diploid (black) and aneuploid (gray) HCRs derived from sorted primary tumor biopsies were used as template for quanitative PCR analysis. Probes from several genomic loci (FHIT, p16, and c-erbB2) were used to determine copy number in three primary tumor pair HCRs (BBR44, BBR49, and CHTN5). The data from the Applied Biosystems 7700 Sequence Detector was analyzed with Microsoft excel to produce the graphs shown. (x axis, the cycle number during the reaction; y axis, the fluorescence detected.)

