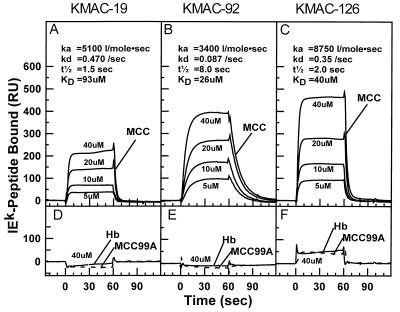
Figure 3.
Kinetics of the interaction of soluble IEk-peptide with immobilized KMAC TCRs. Various concentrations (5–40 μM) of soluble IEk-MCC (solid line) were injected at 10 μl/min for 60 s through biosensor flow cells in which (A) KMAC-19, (B) KMAC-92, or (C) KMAC-126 TCR had been immobilized and the binding kinetics recorded. As a control for bulk fluid phase refractive index the IEk-MCC preparations were also injected through a fourth flow cell with an immobilized irrelevant TCR from the IAd/ovalbumin specific T cell hybridoma, DO-11.10. The differences between these two curves are shown for each IEk-MCC concentration. Average association and dissociation rates were derived from the data by using standard BIAcore biaevaluation software, and these were used to calculate the half-life (t½) and dissociation constant (Kd) of the TCR/MHC complex. (D–F) A single concentration of 40 μM IEk-MCC99A (dashed line) or IEk-Hb (dotted line) was injected through the same flow cells containing immobilized the KMAC TCRs. The data were corrected for bulk fluid phase refractive index as above.

