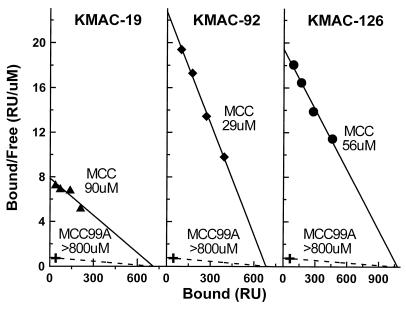
Figure 4.
Scatchard analysis of the interaction of soluble IEk-peptide with immobilized KMAC TCRs. The equilibrium resonance units values in Fig. 3 (A–C) were used to construct Scatchard plots. The Kd of the KMAC-126 TCR interaction with IEk-MCC was estimated from −1/m, where m was the slope of the least squares regression line (solid line) fit to the data. The maximum binding capacity of the flow cells was estimated from the intercept of this line with the x axis. Assuming this potential binding capacity and a minimum significant binding of 30 resonance units at a 40 μM injection (X) the minimal Kd for IEk-MCC99A was estimated at >800 μM (dashed line).

