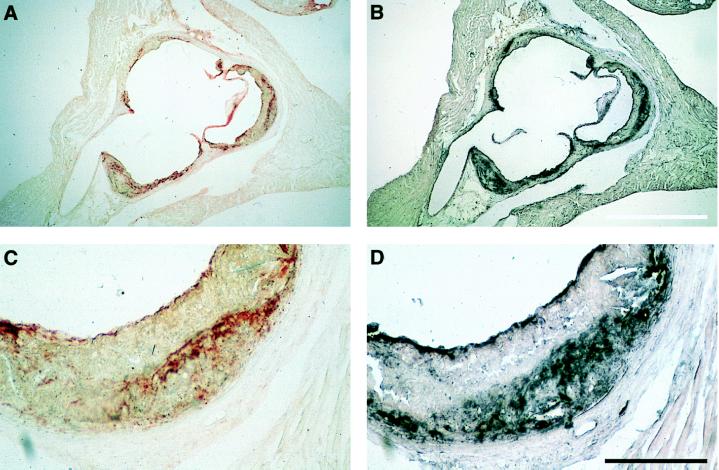
Figure 4.
Immunostained lesions from serial sections of the aortic root of a LDLR−/−;Tg(apoB+/+);Tg(apoa+/−) male mouse. (A and B) Low power images showing the distribution of apoB (A) and apo(a) (B) in adjacent sections. (C and D) High power images detailing the distribution of apoB (C) and apo(a) (D) in the same lesion. Scale bars represent 1 mm (A and B) and 200 μm (C and D).

