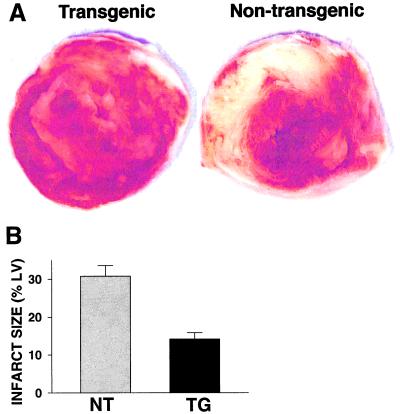
Figure 5.
Infarct size measurement in NT and TG hearts. Hearts were sliced into 1.5-mm thick sections and stained with a 2% solution of TTC, which stains viable myocardium brick red and infarcted myocardium white. A shows typical slices from NT and TG hearts. Quantitative analysis was performed by computerized planimetry of each section. Percent infarction was determined from the mass weighted average of the ratio of infarct area to total left ventricle area from each slice. Measurements were performed on seven hearts in each group with the mean values ± SEM shown in B.

