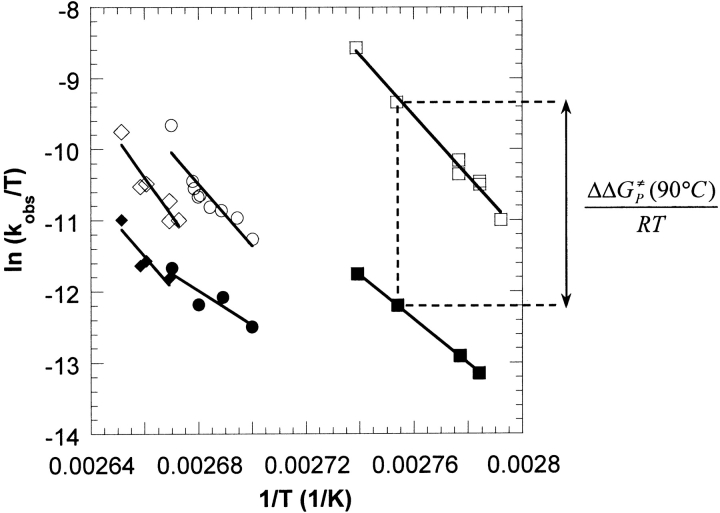
Fig. 3.
Eyring plots showing the effect of pressure on the thermostability of Tl T138E (□,▪), wild type (○,•), and D167T (⋄,♦) glutamate dehydrogenases (GDHs). The open and filled symbols represent thermoinactivation experiments at 5 and 500 atm, respectively. As shown for the T138E GDH at 90°C, the difference in the ΔG≠ of inactivation at low and high pressure (i.e., ΔΔG≠P) is proportional to the vertical distance on an Eyring plot.

