
Fig. 4.
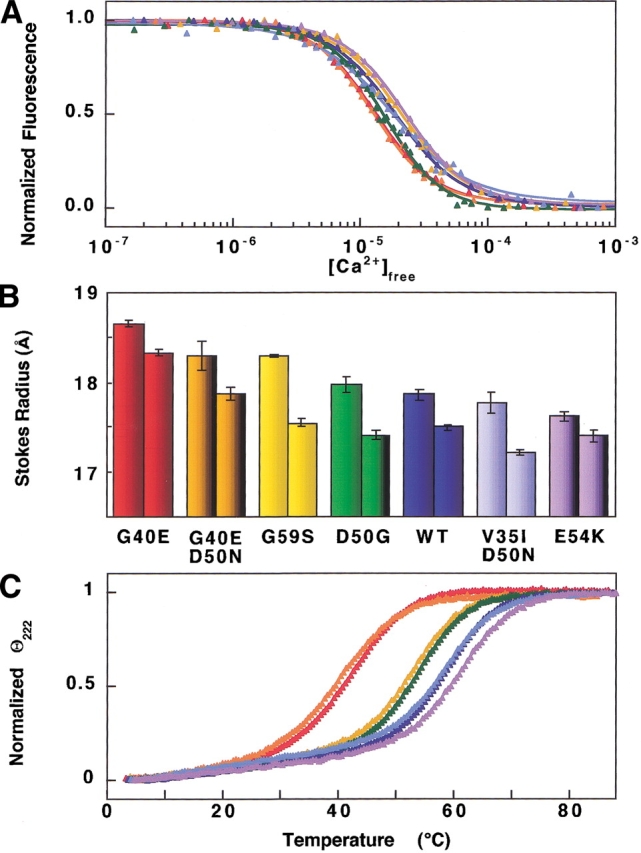
G40E (red), G40E,D50N (orange), G59S (yellow), D50G (green), wild type (blue), V35I,D50N (light blue), E54K (purple). (A) Calcium titrations of mutant and wild-type PCaM1–75 sequences monitored by phenylalanine fluorescence. One representative data set and simulated curve is shown for each sequence. Averages and standard deviations of free energies of calcium binding to sites I and II from four trials are reported in Table 1. (B) Stokes radii of mutant and wild-type PCaM1–75 in the absence (first bar) and presence (second bar) of calcium. Error bars indicate standard deviations of three trials for each sequence. (C) Representative thermal denaturation data and simulated curves for one trial of mutant and wild-type PCaM1–75 sequences. Averages and standard deviations of the Tm, ΔH, and ΔCp values from three trials are listed in Table 3.