Fig. 1.

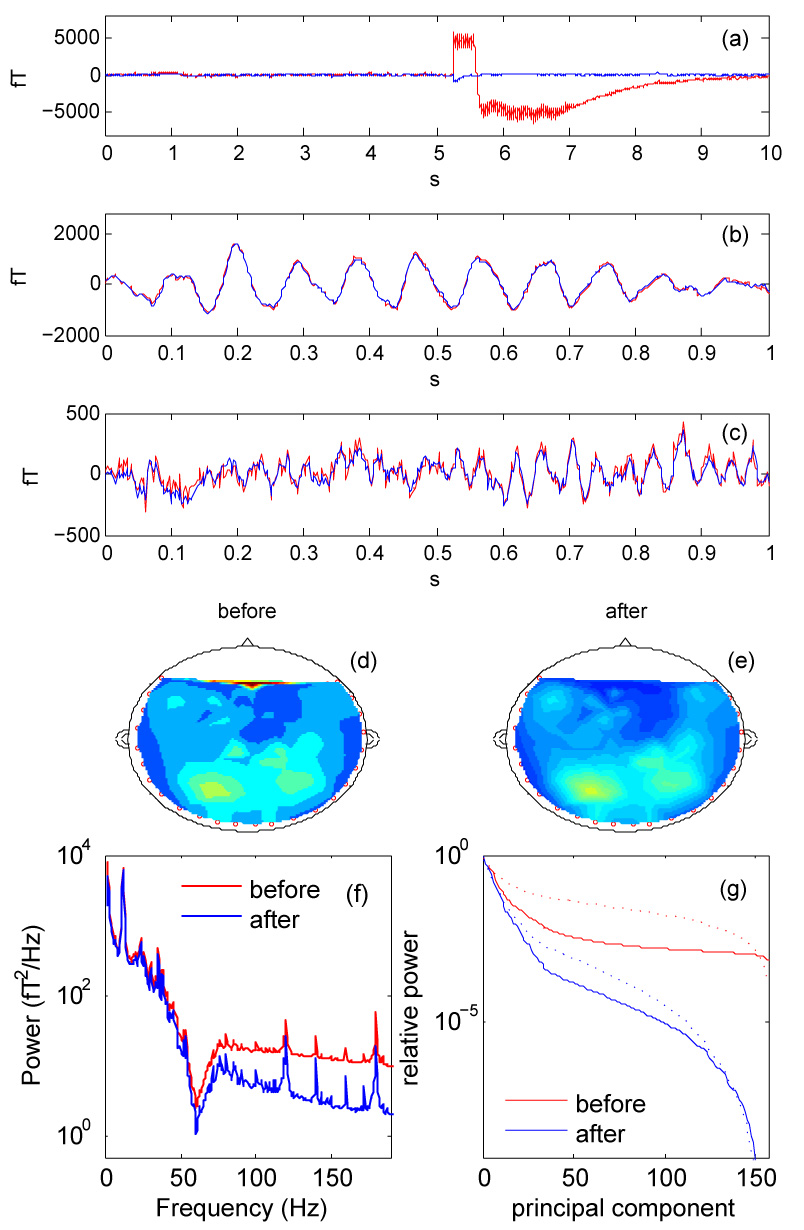
(a, b, c): Waveforms of individual channels of a 157-channel MEG recording, before (red) and after (blue) denoising. In (a) the channel is subject to a “glitch" of unknown origin, that denoising removes. In (b) denoising hardly affects the relatively high-amplitude waveform of what seems to be alpha-band brain activity. In (c), denoising attenuates the high-frequency noise riding on what seems to be theta-band brain activity. (d, e): RMS field distributions before (d) and after (e) denoising. (f): Power spectrum averaged over all channels, before (red) and after (blue) denoising. (g): PCA spectrum (relative power of principal components) before (red) and after (blue) denoising. Dotted line: proportion of power lost by discarding components beyond a given rank before (red) and after (blue) denoising.
