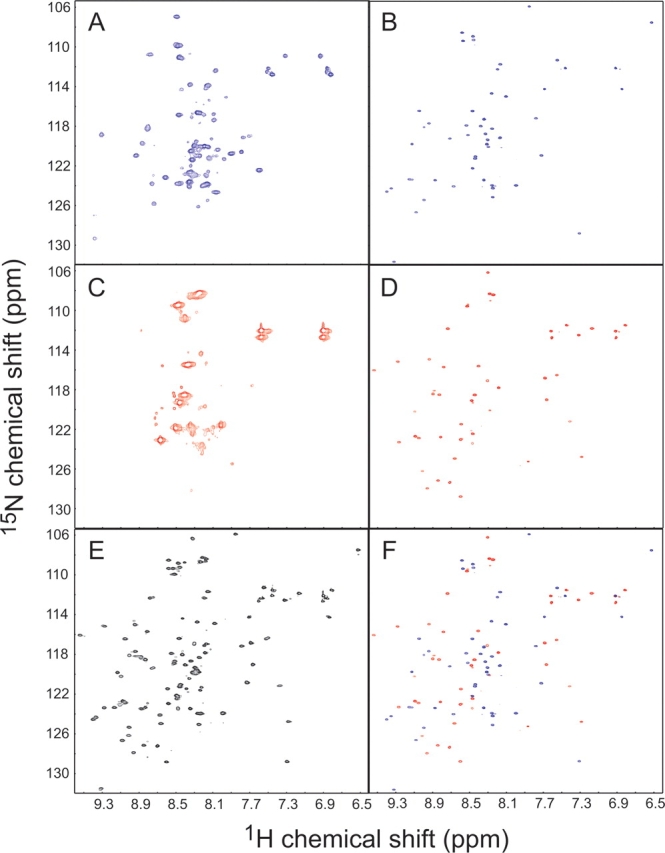
Figure 4.

1H-15N HSQC spectra of the 15N-labeled DEFG fragment in isolation (A) and in the presence of an excess amount of unlabeled ABC fragment (B); those of 15N-labeled ABC fragment in isolation (C) and in the presence of an excess amount of unlabeled DEFG fragment (D); and that of the uncut protein (E). The spectrum in F is the composite of those shown in B and D.
