
Figure 2.
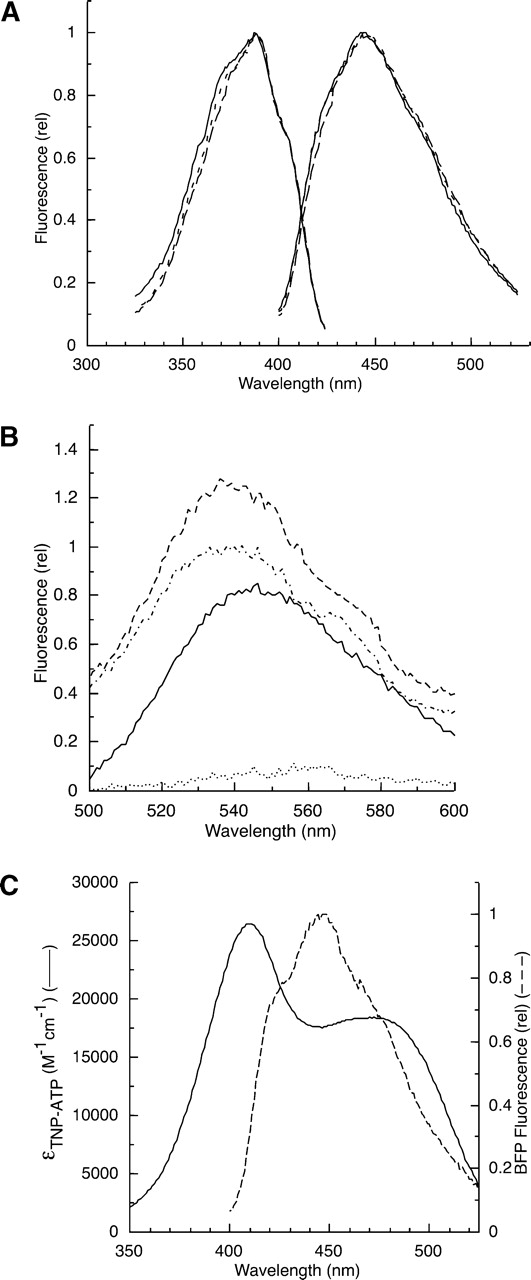
(A) Fluorescence spectra of the purified EGFR-ICD-BFP proteins. The excitation and emission spectra of EGFR-ICD-BFP (solid line), EGFR-Δ1022-BFP (long dashes) and EGFR-Δ976-BFP (short dashes) were recorded with 8-nm excitation and emission band passes and corrected by subtraction of a buffer blank spectrum. (B) Fluorescence emission spectra of TNP-ATP recorded in the presence of buffer alone (dotted line), EGFR-ICD-BFP (solid line), EGFR-Δ1022-BFP (dotted/dashed line), and EGFR-Δ976-BFP (dashed line). (C) Spectral overlap of the fluorescence emission spectrum of EGFR-ICD-BFP (dashed line) and the TNP-ATP absorbance spectrum (solid line) normalized to the units of extinction coefficient.