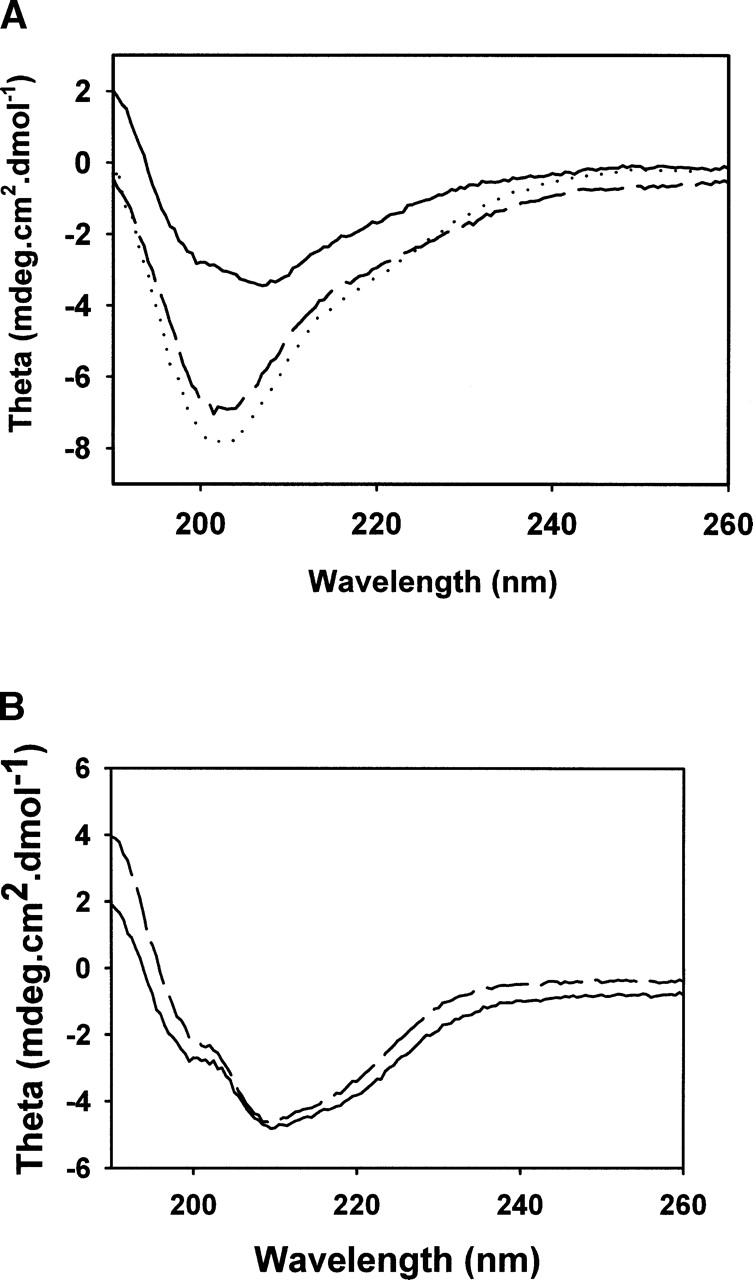
Figure 3.

CD spectra of different forms of eMsrBs (A) and nmMsrBs (B). (A) Wild-type (solid line), C45D/C48S/C94S/C97S (dashed line) and wild-type apoform (dotted line) eMsrBs. (B) Wild-type (solid line) and D45C/S48C/S94C/A97C (dashed line) nmMsrBs. CD spectra were scanned from 260 to 190 nm in potassium phosphate buffer 10 mM (pH 7.1) at 25°C, and at an enzyme concentration of 5 μM.
