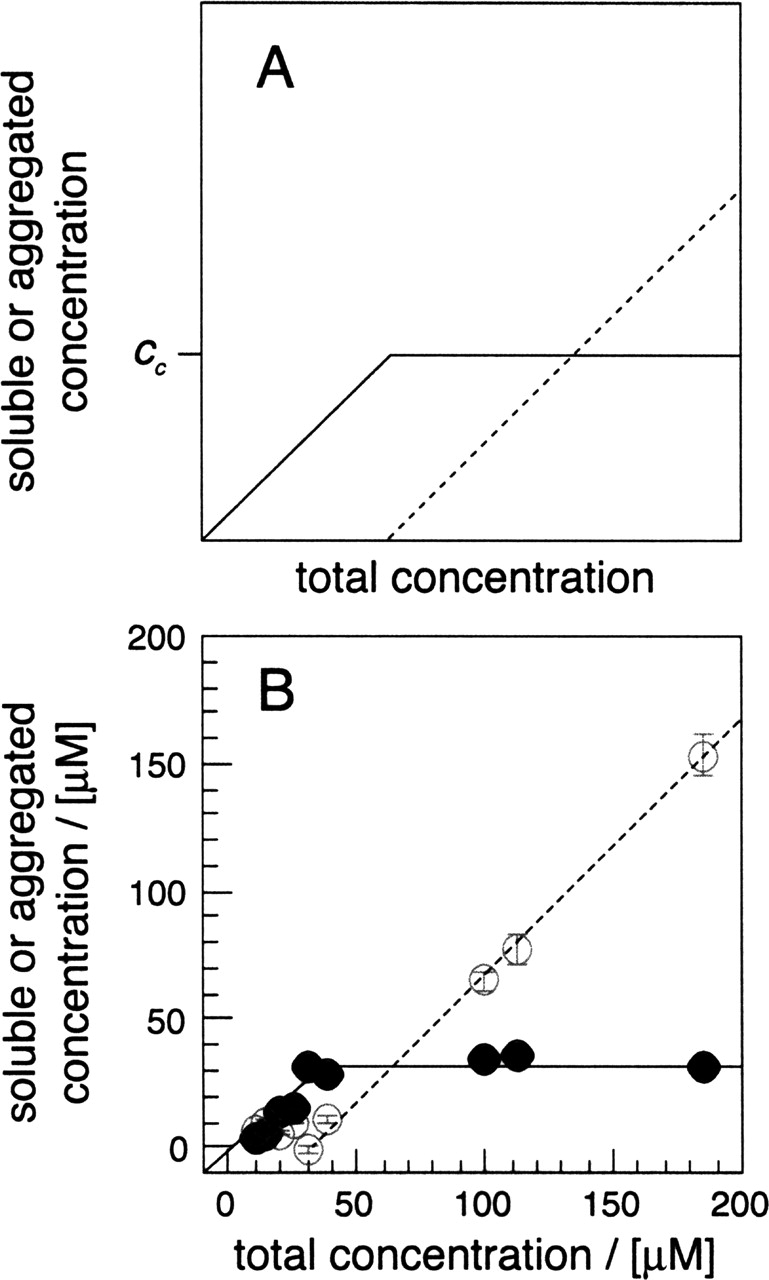
Figure 1.

Measurement of cc. (A) Schematic representation of the critical concentration (cc). (Continuous line) Soluble peptide concentration; (dotted line) aggregated peptide concentration. (B) Soluble peptide (filled symbols) and insoluble peptide (open symbols) after 28 d of incubation. The soluble fraction was obtained from two samples per concentration that were incubated separately. Data points represent the averages, while error bars show the standard deviations (mostly smaller than the symbol size).
