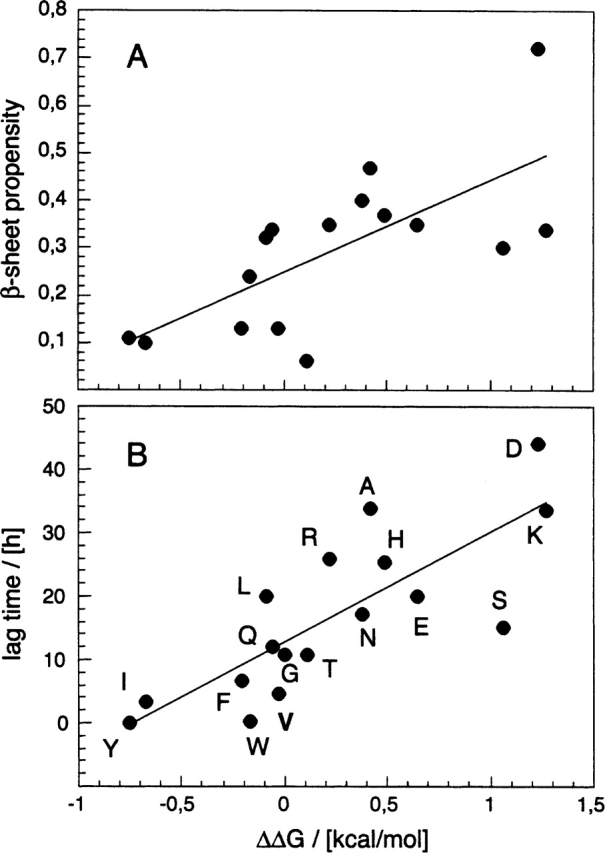
Figure 2.

Correlation between the thermodynamics and the kinetics of aggregation. (A) Correlation between ΔΔG and the β-sheet propensity scale published by Street and Mayo (1999), which represents an average from several independent measurements (R value 0.70). Note that for Pro or Gly no propensity values have been reported. (B) Correlation between ΔΔG and the lag time as a measure of the aggregation kinetics (R value 0.80). Values of ΔΔG are taken from Table 1. The lag time data are taken from Christopeit et al. (2005).
