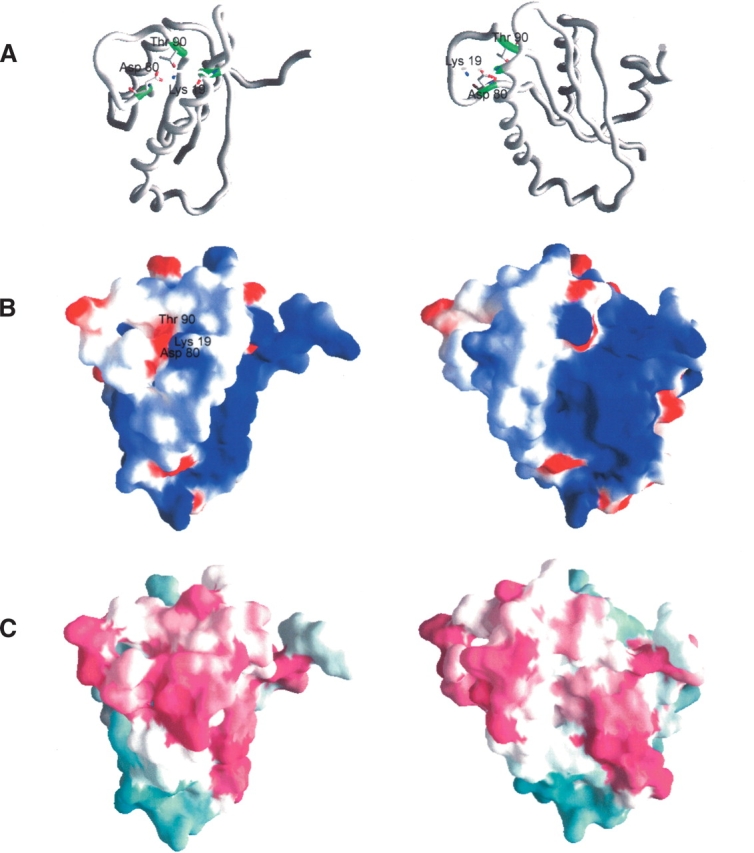
Figure 2.

Structures of A. fulgidis AF2095. (A) Carbon-α backbone of AF2095. Residues proposed to form the catalytic triad (Lys 19, Asp 80, Thr 90) are shown in sticks in green. (B) Electrostatic surface of AF2095, in the same orientation as in A. The electrostatic surface was calculated by using a salt concentration of 0.1 M, and the color scale is −5 kt (negative, red) to 5 kt (positive, blue). (C) Phylogenetic analysis of AF2095 performed with the program ConSurf (Glaser et al. 2003). Maroon indicates conserved; cyan, variable. Sequences used in the ConSurf analysis were obtained from a PSIBLAST search against the nonredundant database using an e-value <0.001 after four iterations. Conserved residues cluster to the β3–β4 loop and the N terminus of α1, as well as to the region containing a surface patch of positive electrostatic potential. The right column is rotated −45° about the Y-axis, relative to the left column.
