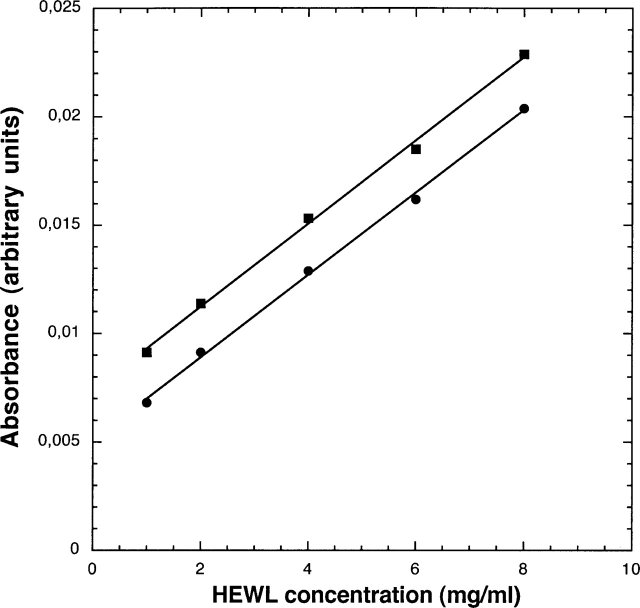
Figure 2.
Peak values of the amide I and II bands as a function of lysozyme concentration. The values of the absorbances at the peaks of the amide I and II bands in the spectra of Figure 1 ▶ are shown as a function of the lysozyme concentration. Squares and circles correspond to the amide I and amide II bands, respectively. The straight lines were obtained by linear regression.

