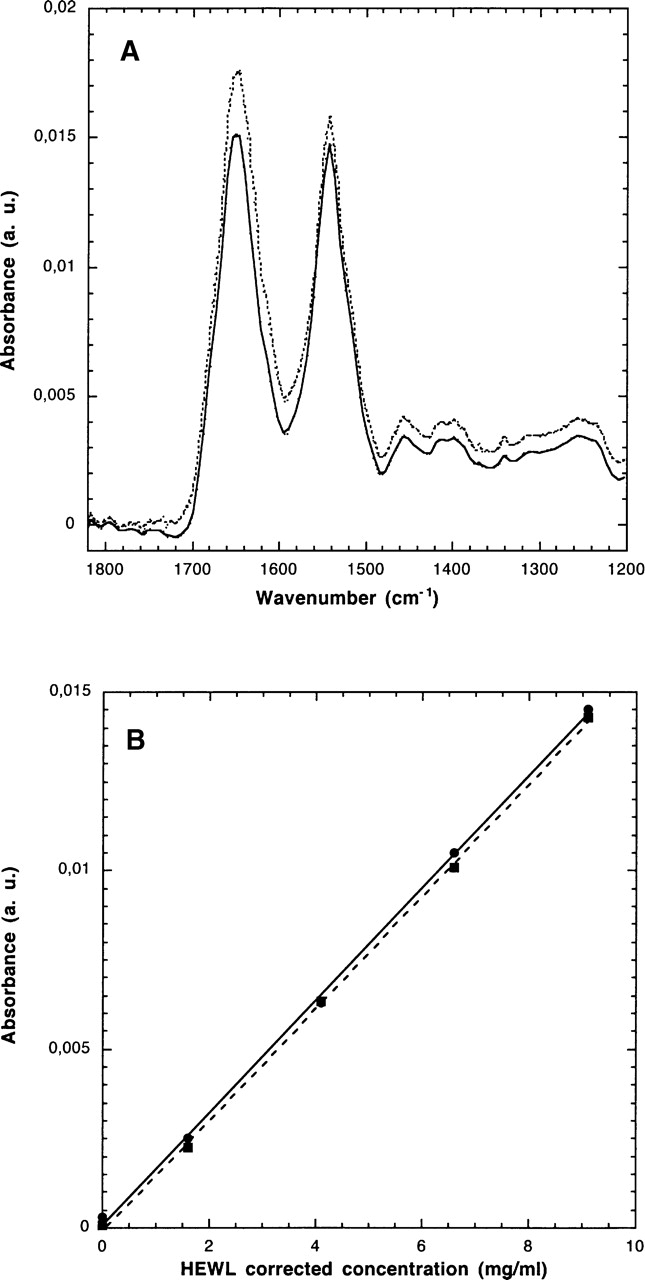
Figure 4.

Corrected ATR/FTIR absorption spectra of a lysozyme solution. The transmission spectra of buffer and of lysozyme solutions at 0.9, 2.5, 5, 7.5, and 10 mg/mL were successively recorded. A new recording was then made with the 0.9-mg/mL solution. The absorption spectra were constructed from the spectrum at each concentration using that at 0.9 mg/mL as the 100% transmission reference. (A) The spectrum constructed from the 10 mg/mL (corresponding to a 9.1-mg/mL solution) is shown in solid line. The spectrum distortion due to the protein refractive index increment was corrected as indicated in Materials and Methods. The corrected spectrum is shown in dotted lines. (B) The amide I (filled circles and solid line) and amide II (filled squares and dotted line) peak heights derived from the spectra corrected only for the adsorption are shown as a function of the lysozyme corrected concentration (i.e., the concentration at which the spectrum was recorded minus 0.9 mg/mL, the concentration of the solution used as the reference). The straight lines were obtained by linear regression.
