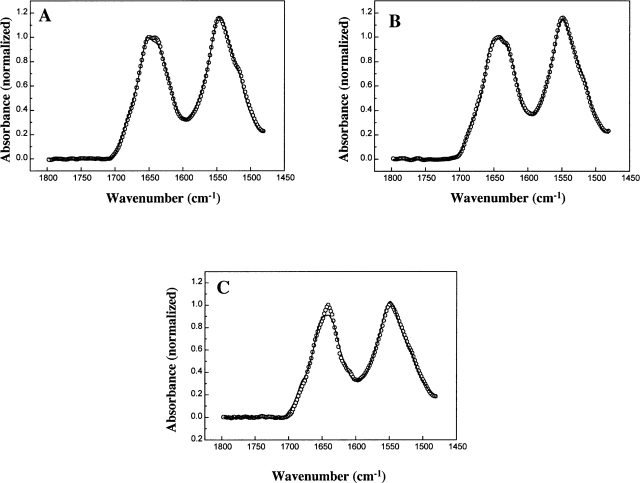
Figure 5.
Spectral analysis of test proteins. The corrected ATR/FTIR absorption spectra of E. coli maltose binding protein (A), FKPA prolyl cis–trans isomerase (B), and thioredoxin (C) were constructed and analyzed using the adapted VARSELEC method selecting the best set of 26 spectra among the 29 (spectra) of the complete database. For each protein, the open circles show the experimental data and the solid line corresponds to the theoretical spectrum reconstructed from the best fit.

