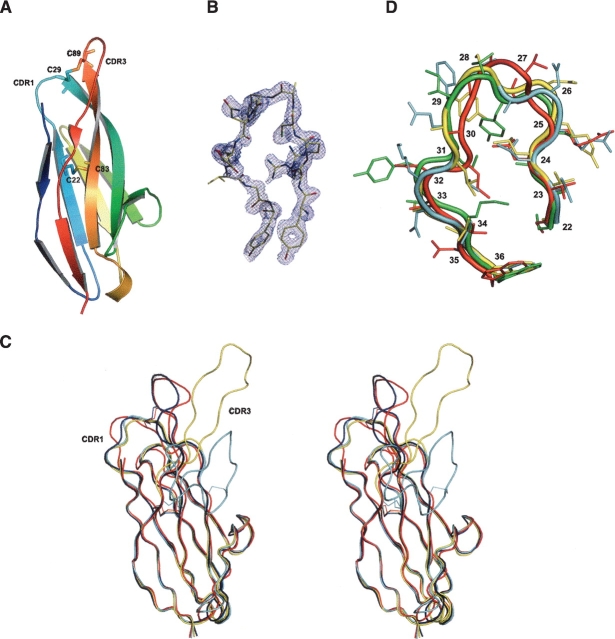
Figure 1.
Structure of the 12A-9 Type 2 IgNAR antibody variable domain. (A) PyMOL image of the 12A-9 molecule in cartoon representation and colored in rainbow fashion (blue N terminus through to red C terminus). Cysteine residues and disulfide bonds are shown as sticks. (B) XtalView/Raster3D image of σA-weighted (2m|Fo|-D|Fc|) electron density of the CDR3 loop of the 12A-9 molecule. The contour level is 1σ. (C) Stereo pair for superimposed structures of IgNAR Type 1, (1SQ2) (cyan); Type 2, 12A-9 (red) and 12Y-2 (1VES) (yellow); and Type 3, modeled (blue) in ribbon representation. Disulphide bonds are shown. (D) PyMol image of superimposed CDR1 loops (22–36) for Type 2 IgNAR’s 12A-9 (red) and 12Y-2 (1VES) (cyan), Type 1 IgNAR (1SQ2) (yellow), and camel cAb-Lys3 (1MEL) (green).

