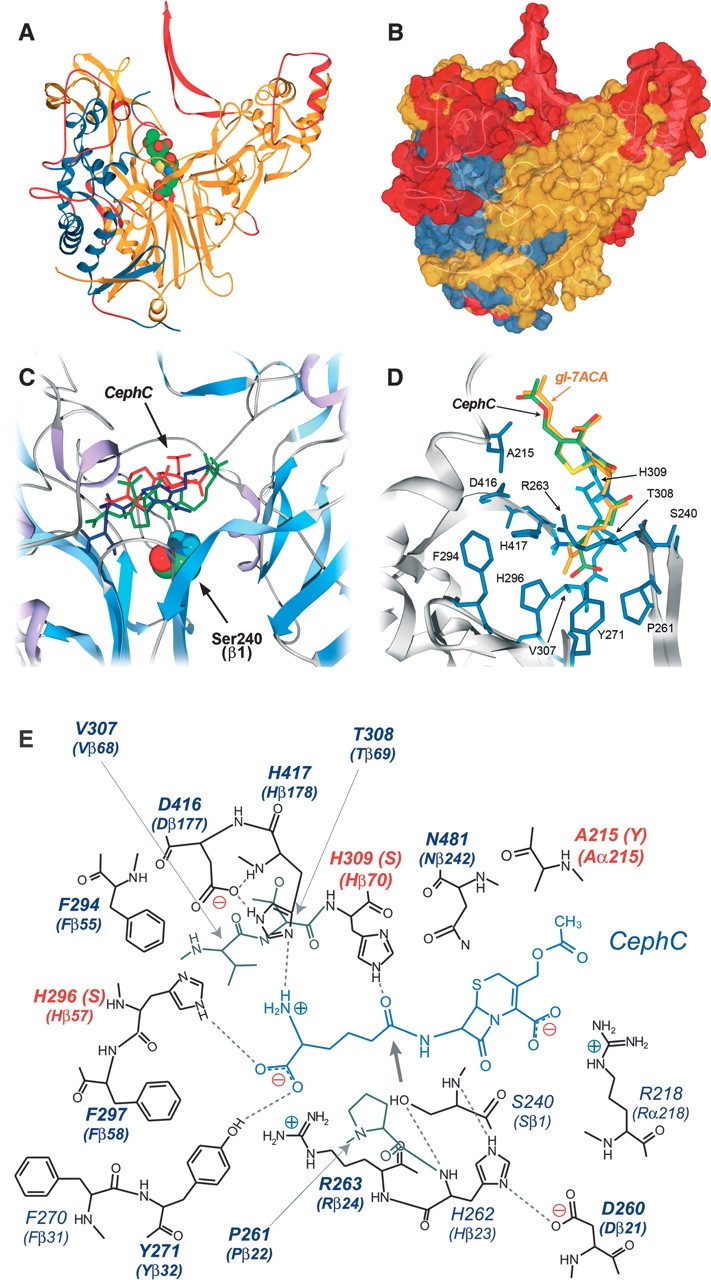
Figure 2.

Three-dimensional model of VAC. (A) Ribbon representation and (B) surface representation of VAC model. (Blue) α-subunit; (yellow) β-subunit; (red) portion of the protein modeled with lower accuracy. The substrate (gl-7ACA) is colored by atom type, and the atoms are depicted by their van der Waals radii. Modeling statistics: 144 amino acids of the α-subunit (60.2%) and 465 amino acids of the β-subunit (86.9%) were modeled by homology; 64 and 69 amino acids were difficult to model for subunits α and β, respectively; 31 and 1 amino acids were not modeled for subunits α and β, respectively. (C) Results of CephC binding to VAC active site by the Autodock 3.0 program. The three substrate conformations possessing the lowest docked energy are depicted in red, blue, and green. (D) Model manually proofread for binding of CephC (green) and gl-7ACA (yellow) at the active site of the VAC model. (E) Schematic representation of the hydrogen-bond network in the CephC–VAC model complex. The positions subjected to saturation mutagenesis are shown in bold. The hydrogen bonds are marked as dotted lines; the thick arrow indicates the position of the site of CephC hydrolysis respect to the OH-group of S240. The residues modified in the best VAC variants are highlighted in red.
