
Figure 1.
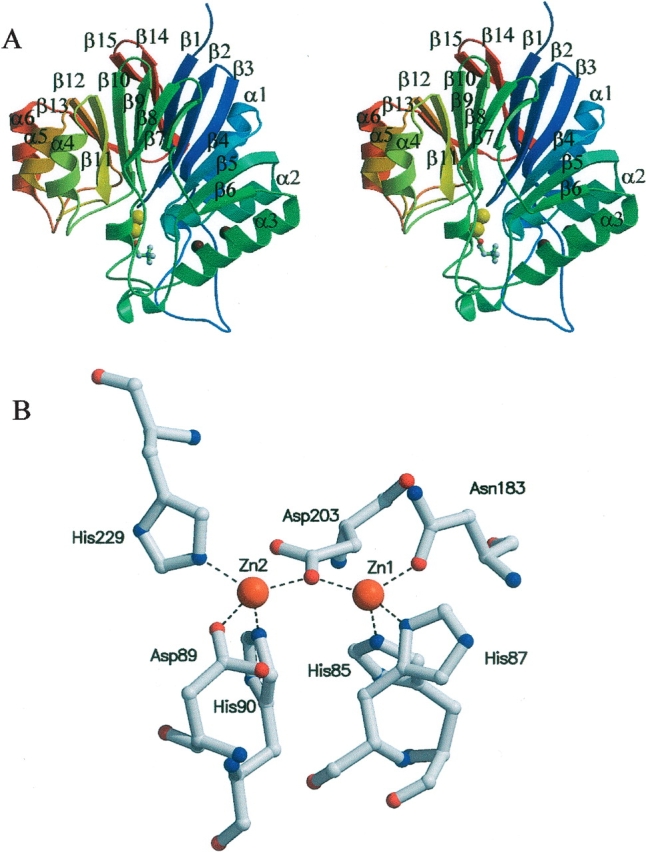
Structure of the Pce catalytic module. (A) Stereo view ribbon diagram of the catalytic module taken from Pce structure (PDB code 2BIB). The sequence is colored from blue at residue 1 to red at residue 301, and the secondary structure elements are labeled. The PC molecule at the active site is drawn in a ball-and-stick representation, while zinc ions are represented as yellow spheres. (B) Bimetallic cluster in the Pce active site. Broken lines indicate bonds between Zn2+ ions (orange) and Pce residues.