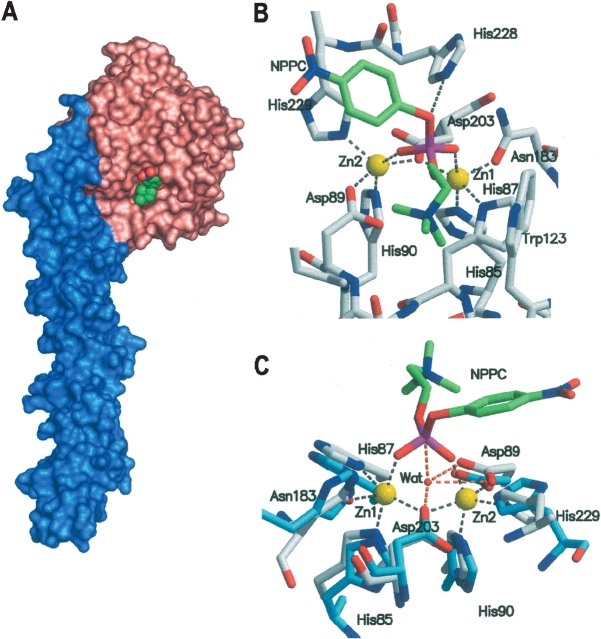
Figure 6.
Three-dimensional model of the Pce:NPPC complex. (A) Structure of Pce in complex with NPPC (spheres). Pce molecular surface is colored according to the protein modules (N-terminal catalytic module, salmon; choline-binding module, blue). (B) The contact network at the active site. Broken lines indicate relevant bonds of NPPC (green) or Zn2+ ions with Pce residues. (C) Close-up view of the model of NPPC:Pce (gray) superimposed with human glyoxalase II (blue; PDB code 1QH3) in stick representation. Gray broken lines are as in B, while orange broken lines indicate putative relevant bonds of Pce residues and NPPC to the solvent molecule bound to the binuclear metallic cluster of glyoxalase II. H228 from Pce was omitted for clarity.

