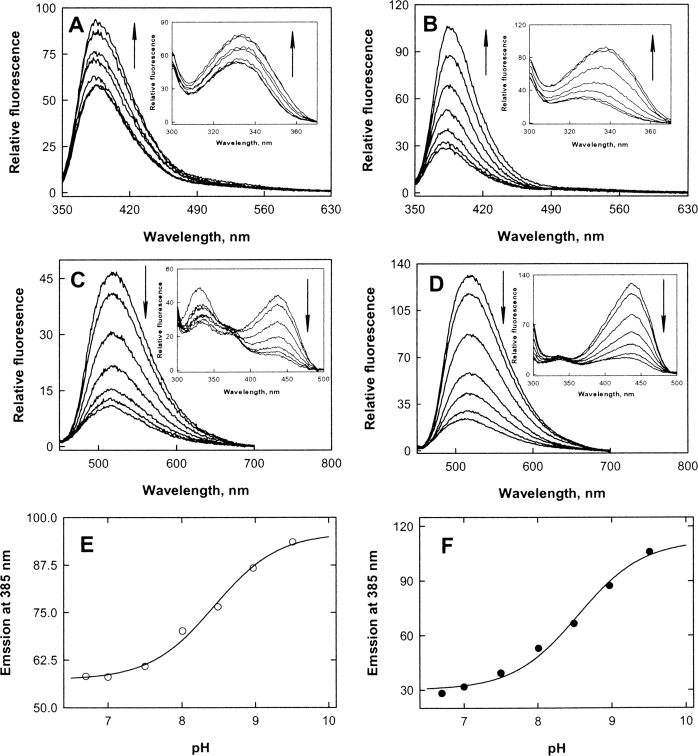
Figure 2.
Fluorescence spectra of ALAS (A,C) and 2XALAS (B,D) and pH profiles for the 385 nm emission fluorescence of ALAS (E) and 2XALAS (F). (A) Fluorescence emission spectra of ALAS at pH 6.7, 7.0, 7.5, 8.0, 8.5, 9.0, and 9.5 upon excitation at 331 nm. (Inset) Fluorescence excitation spectra of ALAS at the same pH values with emission wavelength of 385 nm. (B) Fluorescence emission spectra of 2XALAS at pH 6.7, 7.0, 7.5, 8.0, 8.5, 9.0, and 9.5 upon excitation at 331 nm. (Inset) Fluorescence excitation spectra of 2XALAS at the same pH values with emission wavelength of 385 nm. (C) Fluorescence emission spectra of ALAS at pH 6.7, 7.0, 7.5, 8.0, 8.5, 9.0, and 9.5 upon excitation at 436 nm. (Inset) Fluorescence excitation spectra of ALAS at the same pH values with emission wavelength of 518 nm. (D) Fluorescence emission spectra of 2XALAS at pH 6.7, 7.0, 7.5, 8.0, 8.5, 9.0, and 9.5 upon excitation at 436 nm. (Inset) Fluorescence excitation spectra of 2XALAS at the same pH values with emission wavelength of 518 nm. (E) pH dependence of the 385 nm emission intensity of ALAS (excitation at 331 nm). (F) pH dependence of the 385 nm emission intensity of 2XALAS (excitation at 331 nm). The solid lines in E and F represent the theoretical curves from fits of the data to
 |
Arrows indicate pH increase.

