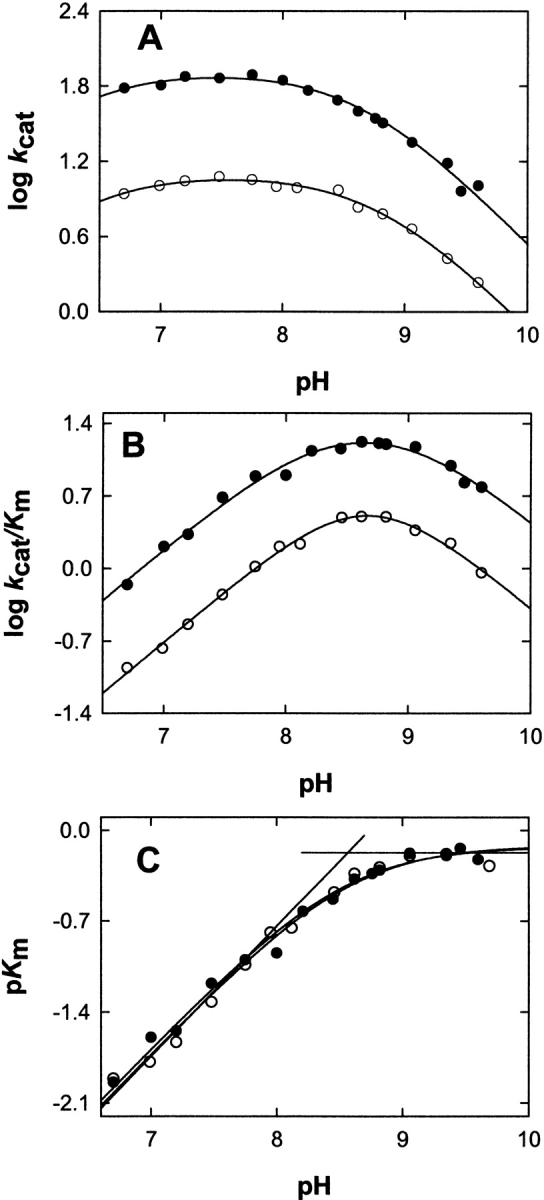
Figure 3.

pH dependence of logkcat, log kcat/Km Gly and pKm Gly for ALAS (A) 2XALAS (B). The lines represent the nonlinear regression to Equation 2 for logkcat and logkcat/Km Gly vs. pH and Equation 3 for pKm Gly vs. pH. The filled and open symbols are for 2XALAS and ALAS, respectively. The concentrations 2XALAS (or ALAS) and succinyl-CoA were maintained at 1.0 μM (or 4.0 μM) and 20 μM, respectively, while the concentration of glycine covered a range from 0.625 to 200 mM. The buffers for different pH values are described under Materials and Methods.
