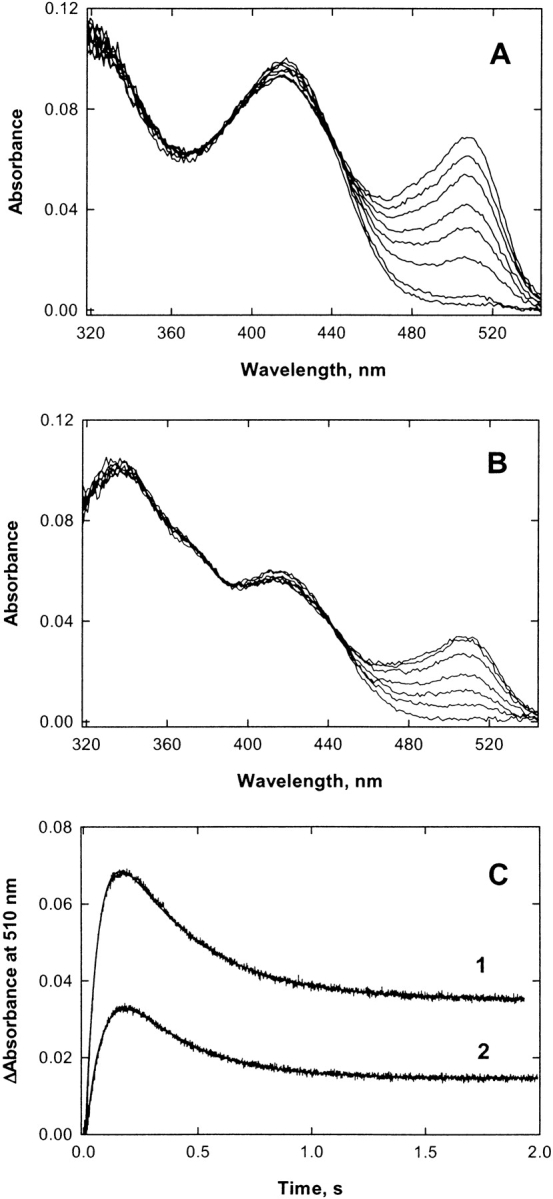
Figure 5.

Reaction of 2XALAS (A) (12.5 μM) or ALAS (B) (50 μM), preincubated with glycine (200 mM), with succinyl-CoA (120 μM) at pH 7.5 and 30°C. (A,B) Selected pre-steady-state spectra from the 2000 spectra collected during the reaction. The concentrations shown in parentheses are final concentrations after mixing. (C) Time courses of the (1) 2XALAS-and (2) ALAS-catalyzed reactions at 510 nm. The time course data were best fitted to Equation 5 for a two-exponential process (see Materials and Methods). An increase, defined by
 |
in the accumulated 510 nm-absorbing species (or EQ2) of 4.1 was associated with the 2XALAS-catalyzed reaction. [E]0 represents the initial enzyme active site concentration.
