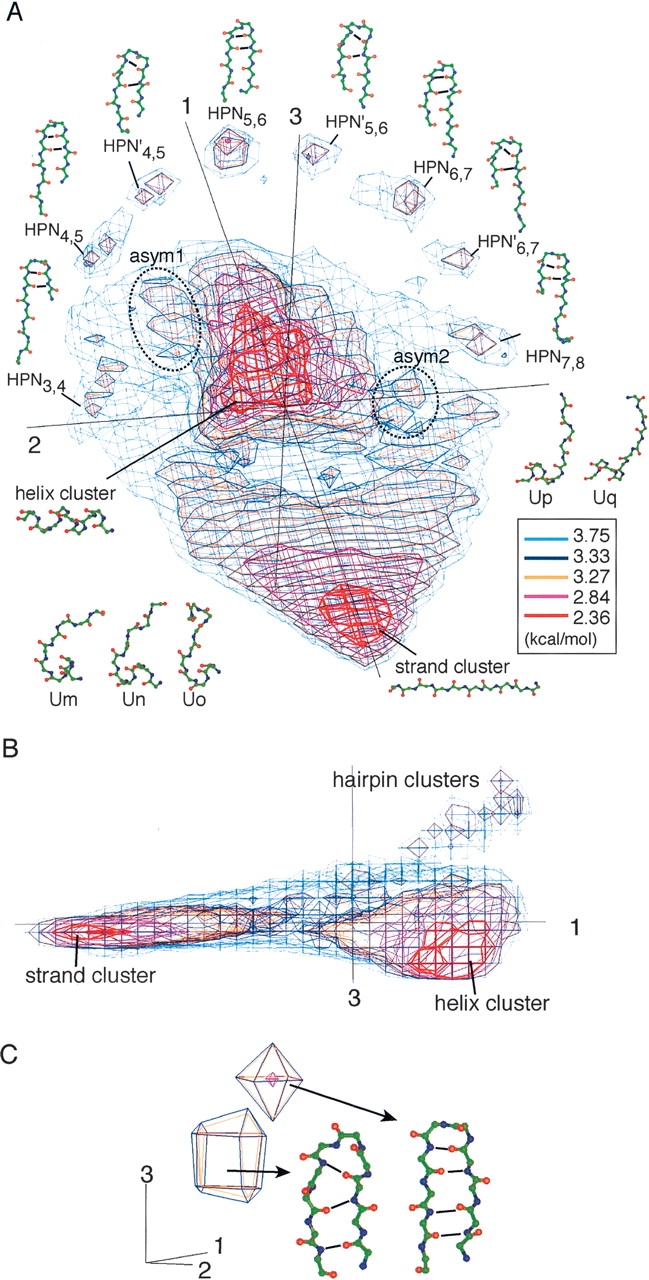
Figure 1.

U10 expressed by PMF contour levels. PCA axis numbers (1, 2, and 3) are given near the axes. (A) Overview of U10. Conformational clusters (e.g., helix, strand, and β-hairpin clusters) and segment conformations picked from each cluster are displayed with the names. Eight conformations are taken from each β-hairpin cluster. To make out the difference between HPN and HPN′, hydrogen bonds in conformations are emphasized with solid lines. (B) Side view of A. (C) Subclusters in a hairpin cluster, HPN5,6, at the symmetrical center. Conformations from the two subclusters had different hydrogen-bonding patterns. Hydrogen bonds are represented by bold lines.
