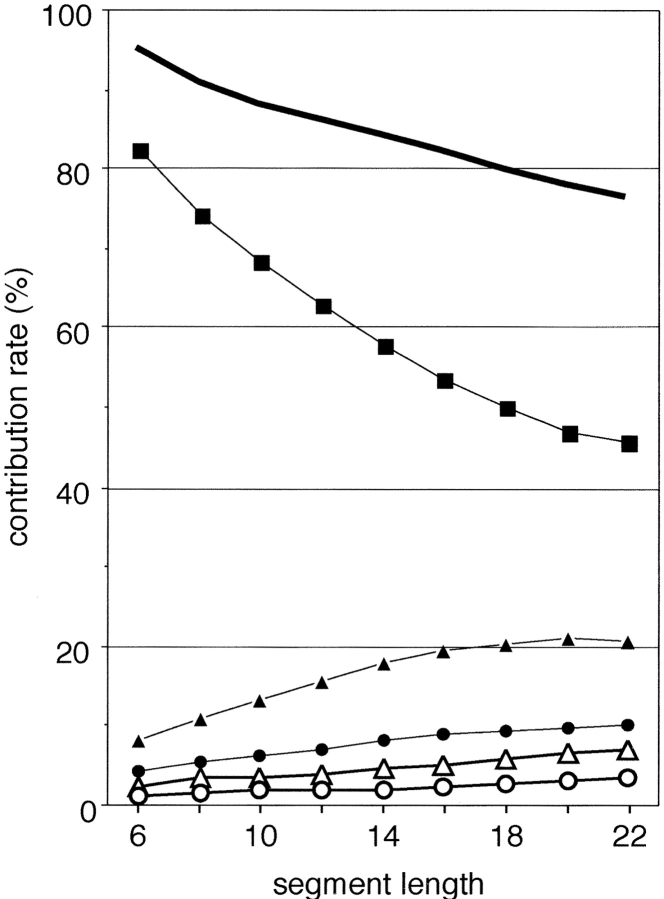
Figure 3.
Contribution rates of principal components for each segment length (6–22 residues long). The first five principal contributions, Q1 (filled squares), Q2 (filled triangles), Q3 (filled circles), Q4 (empty triangles), and Q5 (empty circles), are shown. The bold line indicates the cumulative contribution of the first three principal components, S1–3.

