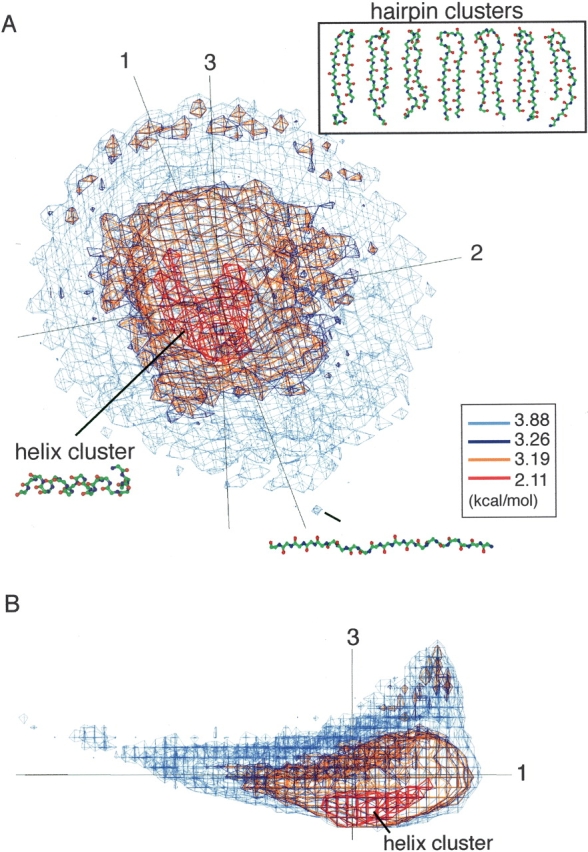
Figure 4.

U20 expressed by PMF contour levels. PCA axis numbers are given near the axes. (A) Overview of U20. β-Hairpin conformations picked from each β-hairpin cluster in U20 are shown in an inset. A fully extended strand found at the tail end of U20. (B) Side view of A.
