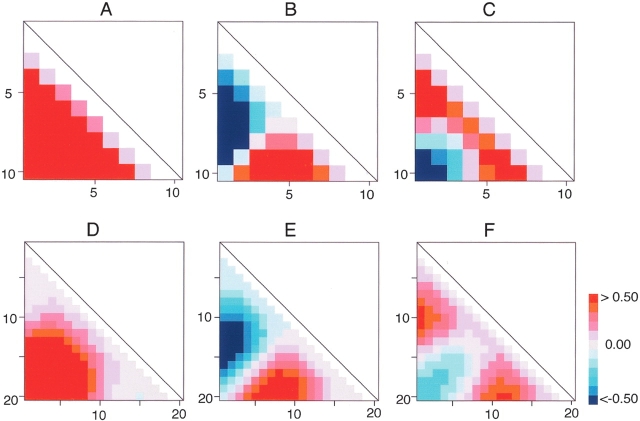
Figure 5.
Triangle maps indicating deviations of Cα–Cα distances along each eigenvector (i.e., each PCA axis) from the mean Cα–Cα distances. Scale bar indicates relative deviation. Red color is anti-phase against blue color. Residue numbers are displayed with horizontal and vertical sides of the triangle maps. (A) v1, (B) v2, and (C) v3 for U10. (D) v1, (E) v2, and (F) v3 for U20.

