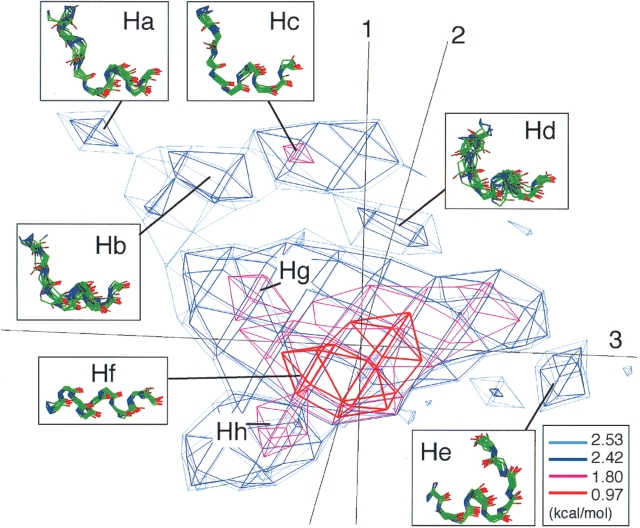
Figure 6.
Helical segment subuniverse of 10 residues long expressed with PMF levels. Each cluster is labeled with its name. PCA axis numbers are given near axes. Conformations arbitrarily chosen from each subcluster are shown in insets. Mean values of main-chain RMSD among the conformations in subcluster Ha, Hb, Hc, Hd, He, Hf, Hg, and Hh are 1.01, 1.48, 0.74, 1.98, 1.10, 0.60, 1.05, and 1.33 Å, respectively.

