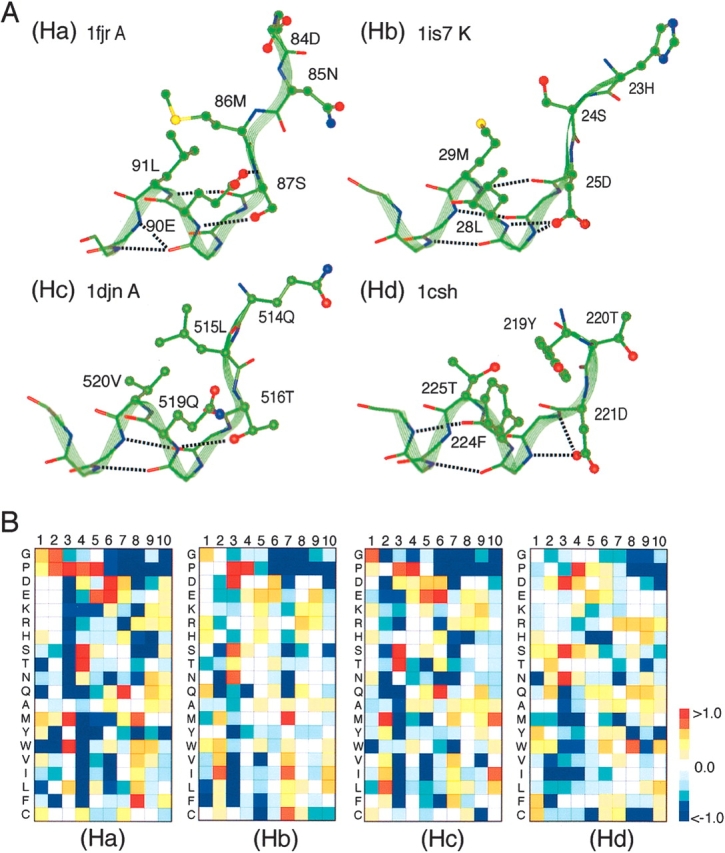
Figure 7.

Conformations and amino acid preferences of helical subclusters Ha–Hd. (A) Typical conformations chosen from Ha–Hd are displayed. Each conformation is shown with residue numbers and PDB code of originated protein. Side-chain conformations that participate in helix capping interactions at the N termini of helices are shown. Broken lines represent hydrogen bonds. (B) Amino acid preference at each position of segments of Ha–Hd. Scale bar with colors represents values of the preference.
