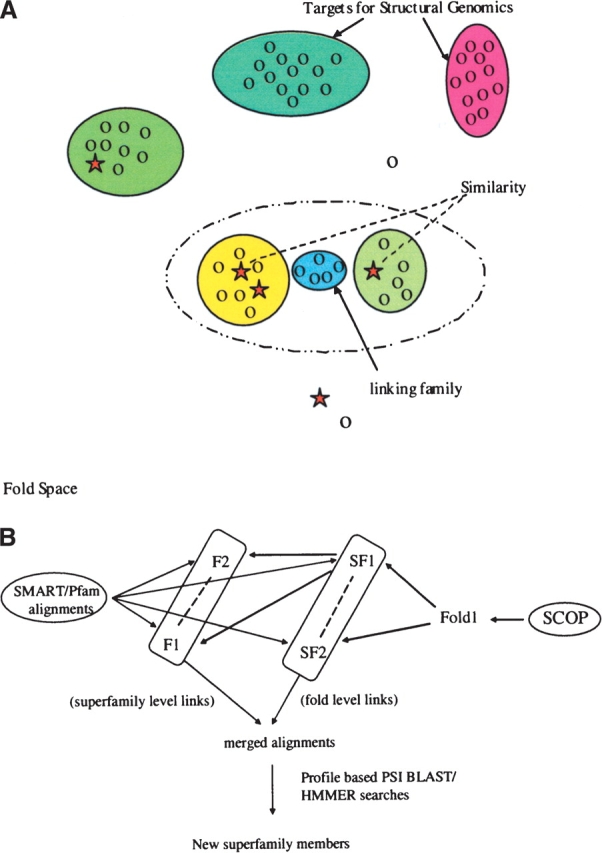
Figure 1.

Merging sequences in folds space to find the bridging families. (A) Representation of fold space where related sequences are grouped into families (or higher-level groupings). Families related by structure (and assumed evolutionary relationship) can be merged to produce a powerful profile, which in turn can be utilized to find the sequences that occur at the “bridges.” Ovals of different colors represent different sequence families that populate fold space. Proteins of known structures are shown as stars; those without, as circles. (B) The strategy that we have used to identify bridging families. We use sequence information from SMART/Pfam and structural hierarchy of SCOP to merge different related families in to new superfamilies. We then use PSI-BLAST or HMMer profiles of the merged superfamily to search the sequence databases to identify the bridging families that may be part of the same superfamily.
