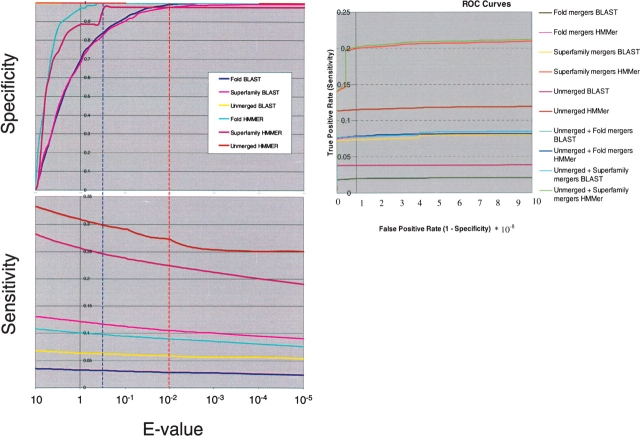
Figure 2.
Benchmarks with SMART and Pfam. Plots of Specificity (upper left) and Sensitivity (lower left) vs. BLAST/HMMer E-value (log scale). Labels indicate the type of profiles used: “Fold,” Pfam/SMART domains merged with structures sharing the same fold, but lying in different superfamilies; “Superfamily,” structures in the same superfamily; “Unmerged” separate Pfam/SMART domains. The vertical broken lines show the thresholds for HMMer (blue) and BLAST (red) chosen in the text to give the optimal results when searching. ROC curve (right) is also shown with the same labels. Curves for Unmerged profiles for Specificity are horizontal on top and sideways for ROC curves and may not be easily visible.

