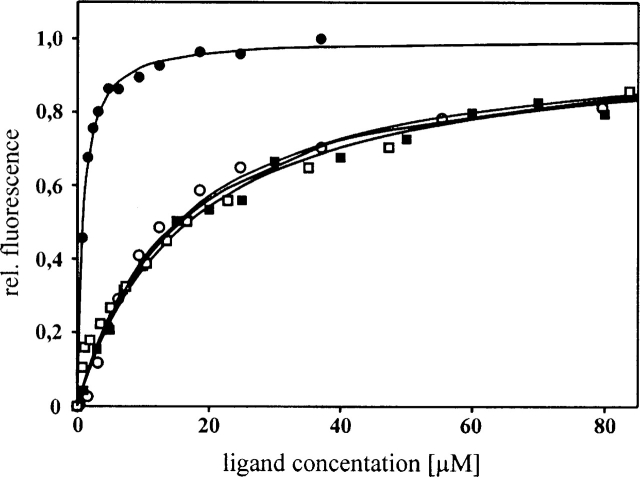
Figure 5.
Fluorescence binding studies of Tip to Lyn-SH3 (filled symbols) and Lck-SH3 (open symbols). Changes in the relative fluorescence are displayed by squares and circles for TipΔC and Tip, respectively. The fluorescence signal was detected at 340 nm after excitation at 280 nm. All intensities were normalized to a maximum value of 1. Curves were fitted according to the equation given in Materials and Methods.

