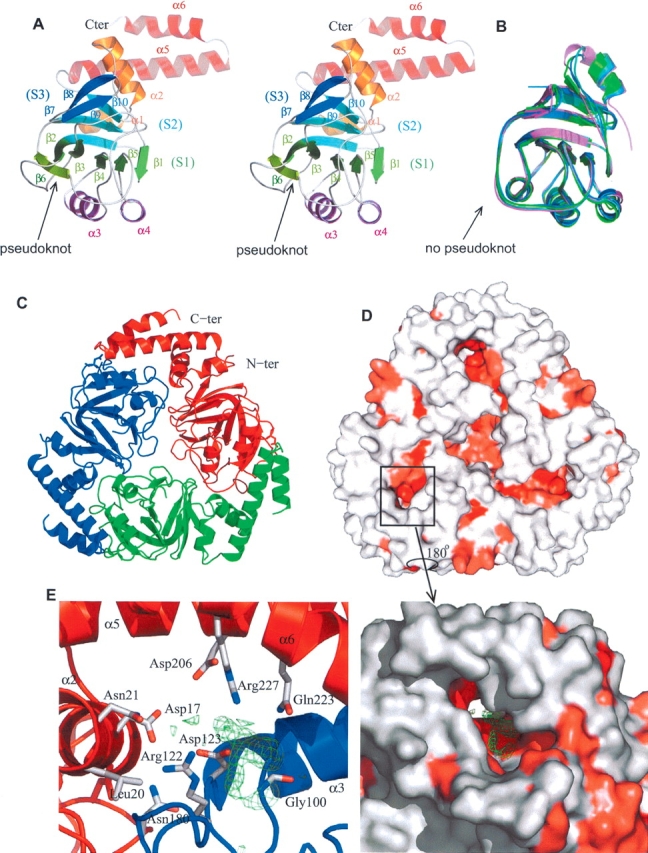
Figure 1.

(A) Ribbon stereo representation of the structure of the Yer010cp monomer. The N- and C-terminal helices are colored in orange and in red, respectively. The second α-helical layer is colored purple. The (S1), (S2), and (S3) sheets are colored green, light blue, and dark blue, respectively. Protein figures are generated by Pymol (http://www.pymol.org). (B) Structural superposition of Yer010cp homologs in the same orientation as A: E. coli (dark blue), T. thermophilus (green), M. tuberculosis (light blue), and V. cholerae (purple). (C) Ribbon representation of the Yer010cp trimer. The three chains are in different colors. (D) Surface representation of the Yer010cp trimer. The surface is colored in increasing shades of red according to residue conservation (red most conserved) as determined by the consurf server (Glaser et al. 2003). (E) Close-up view of the conserved pocket between two monomers in surface (right) or cartoon (left) representation. The residual electron density (Fo−Fc map contoured at 3 σ) is shown in green. The residues lining the tunnel are shown in stick representation.
