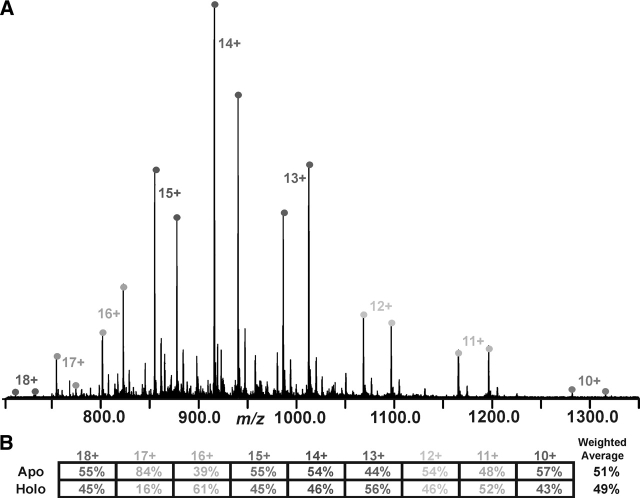
Figure 5.
(A) Broadband spectrum of apo SrfB1 and holo SrfB1 mixed in a 1:1 ratio. (B) The table at the bottom of the figure indicates the percentage of each form for each charge state. A weighted average, in which the most abundant charge state (in this case the 14+ charge state) contributes the greatest amount to the final average, was used to calculate the total percent apo vs. holo. For this spectrum the overall weighted average was apo (51%) and holo (49%).

