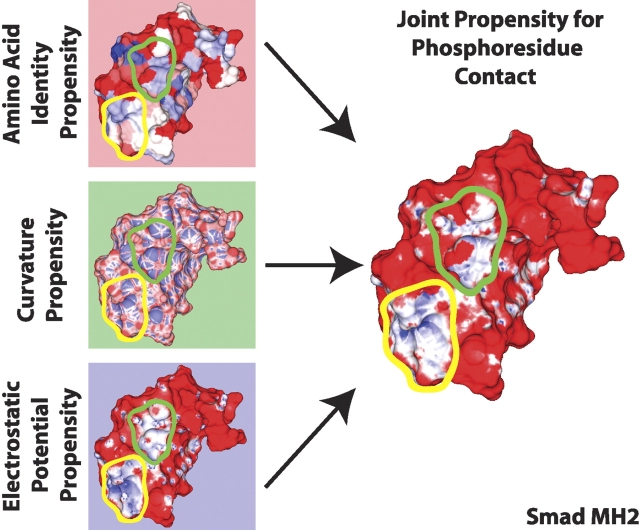
Figure 2.
Calculation of joint propensity for phosphoresidue contact. Propensities were calculated independently for amino acid identity (upper left), local mean surface curvature (middle left), and solvated electrostatic potential (lower left). These propensities were combined multiplicatively to obtain a joint propensity for phosphoresidue contact (right). Two linear scales were used to depict unfavorable and favorable propensity. Unfavorable propensity values from 0 to 1 are colored from red to white. Favorable propensity values are colored from white to blue over the values 1 to 4 for amino acid identity, 1 to 2.5 for surface curvature, 1 to 12 for solvated electrostatic potential, and 1 to 20 for joint phosphoresidue contact propensity. In some regions, as with the area outlined in yellow, the three individually calculated propensities combine constructively to create a large region of favorable joint propensity. In other regions, such as the area outlined in green, an area that looks favorable for phosphoresidue contact by one measure, such as electrostatic potential, combines with the propensities generated by other characteristics to define a site that is less favorable, overall, for phosphoresidue contact.

