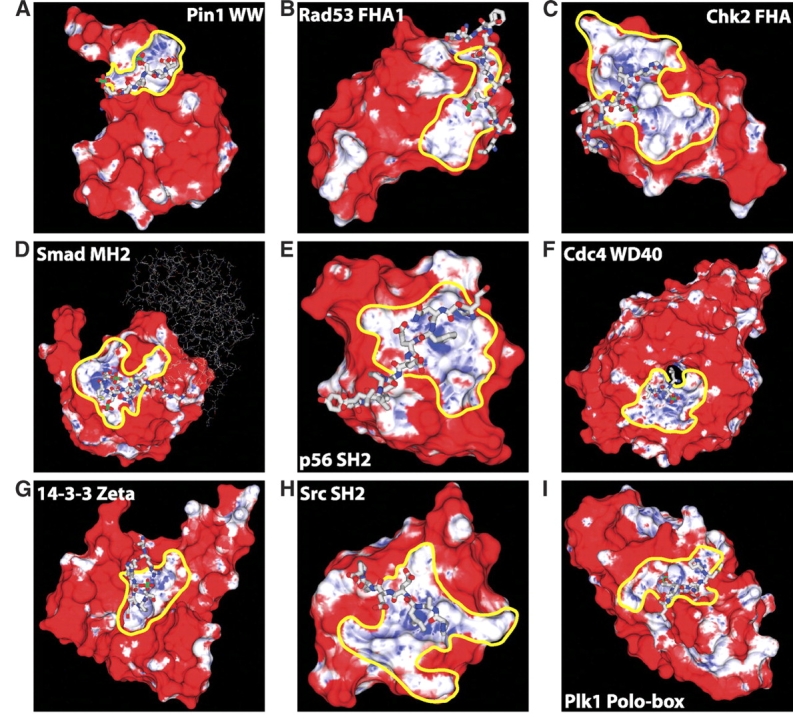
Figure 3.

(All panels) Cross-validation of phosphoresidue contact site predictions on known phosphopeptide binding domains. Phosphopeptides are shown in a licorice representation, with the phosphate atom colored green. Surface coloring is linear from red to white for unfavorable propensity values from 0 to 1, and from white to blue for favorable propensity values of 1 to 30. Predicted phosphoresidue contact sites are outlined in yellow. The phosphopeptide-binding domain shown is indicated within each panel. The skinny sticks in panel D indicate the Smad monomer which contains the bound phosphopeptide. The phosphotyrosine phosphates in panels E and H are buried beneath the phosphate accessible surface.
