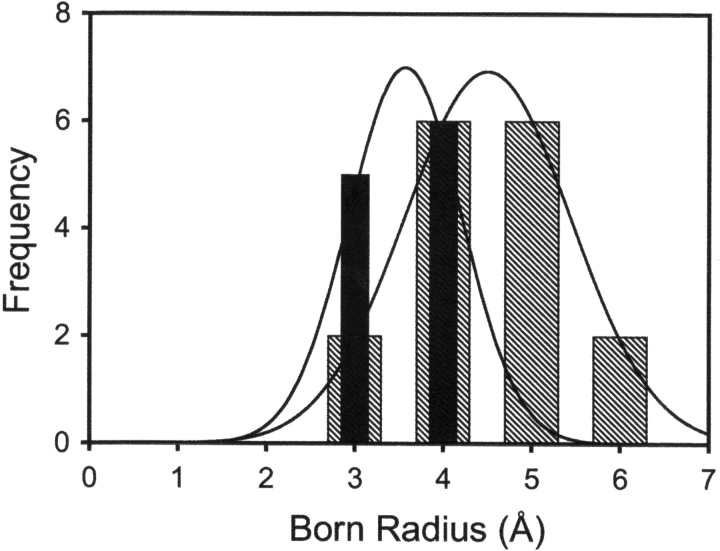
Figure 5.
Histograms of the Born radii of probe amides. Hatched bars indicate amides for which only ΔG°opF was observed (mean radius = 4.44). Filled bars are amides with measured ΔG°opB (mean radius = 3.53). The difference in Born radius between the two groups is highly significant (P < 0.001). Lines indicate fit to a Gaussian curve.

