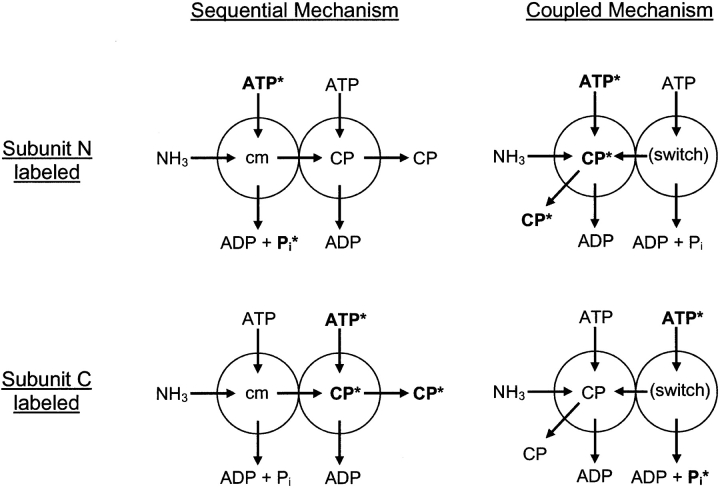
Figure 3.
Schematic of pulse/chase study setup. Subunits N and C of aCPS or mCPS are represented by spheres (left sphere = subunit N, right sphere = subunit C) and the reactions that are proposed to occur on them in the sequential and coupled mechanism are indicated (cm = carbamate). For each mechanism, labeling of either subunit N or C with [γ-32P]ATP is represented. Labeled substrates and products are shown in bold, with the labeled phosphate indicated with an asterisk.

