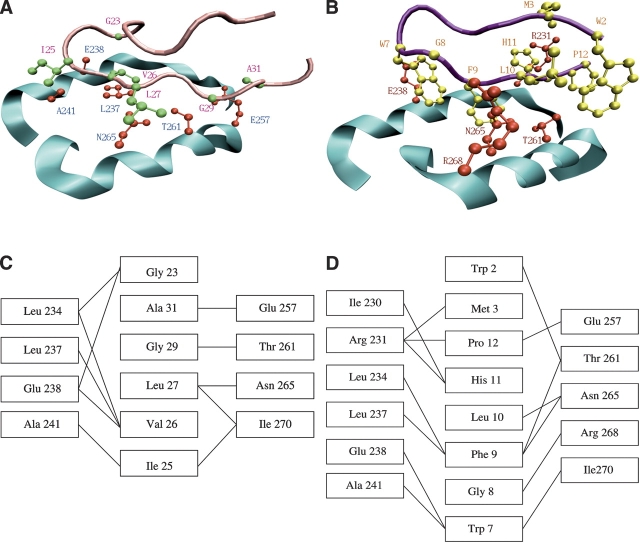
Figure 1.
(A,B) Contacts between GroEL helices H and I (cyan) and (A) the GroES mobile loop (pink) and (B) the SBP (magenta). Side chains of the residues that form the closest contacts are shown in red (GroEL), green (GroES), and yellow (SBP). (C,D) Schematic representation of contacts between GroEL and (C) GroES and (D) SBP. A and B were produced using VMD (Humphrey et al. 1996) and PovRay (Persistence of Vision Raytracer Pty. Ltd.).

