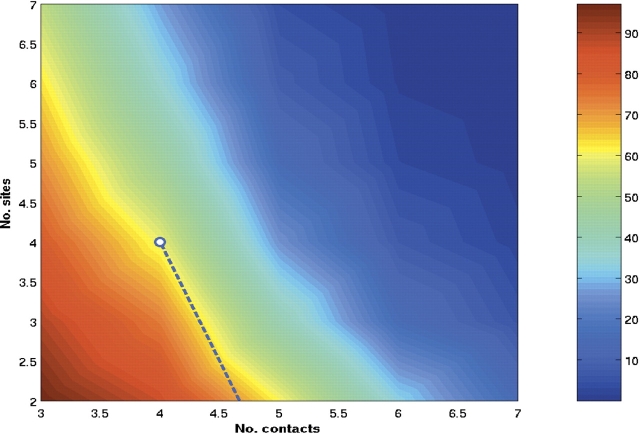
Figure 2.
Contour plot of the percentage of E. coli proteins able to bind to a given number of GroEL sites, NB, as a function of the number of contacts per site, NC. The dotted line represents the boundary of (NC, NB) values below which in excess of 80% of the substrates in the experiments by Houry et al. (1999) are identified.

