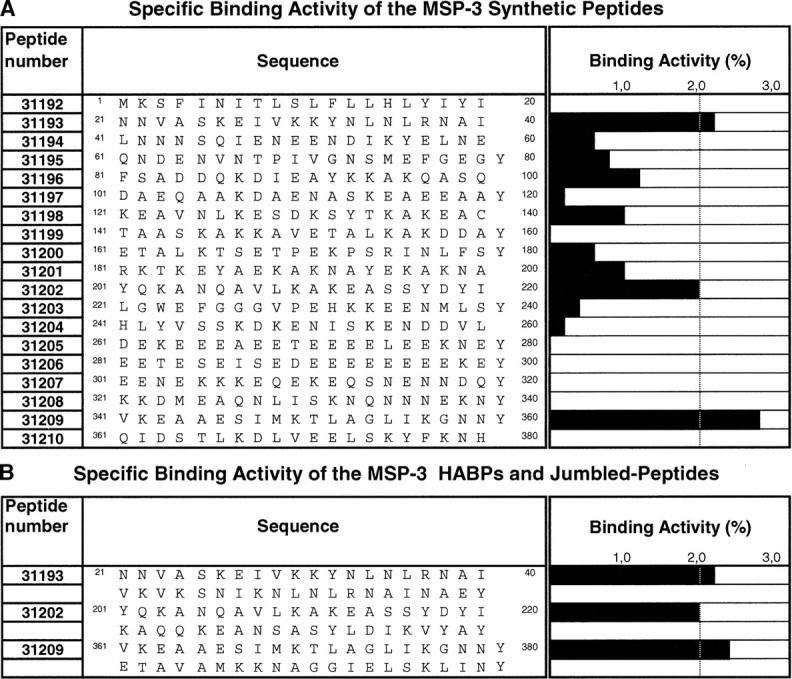
Figure 1.

Erythrocyte binding assays using PfMSP-3 peptides. (A) Each of the black bars represents the slope of the specific binding graph, which is named specific binding activity. Peptides with 2% were considered as having high specific erythrocyte binding (HABPs). (B) Specific binding activity for HABP peptide analogs; original and jumbled peptide sequences are shown to the right, and the bars on the left represent specific binding. The numbers in the first column represent FIDIC’s internal code number for those peptides synthesized.
