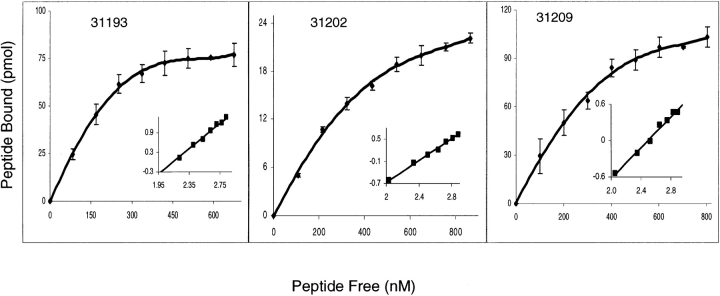
Figure 2.
Saturation curves for 31193, 31202, and 31209 HABPs. Increasing quantities of labeled peptide were added in the presence or the absence of unlabeled peptide. The curve represents the specific binding. In the Hill plot (inset), the abscissa is log F and the ordinate is log (B/Bmax − B), where F is free peptide, B is bound peptide, and Bmax is the maximum amount of bound peptide.

